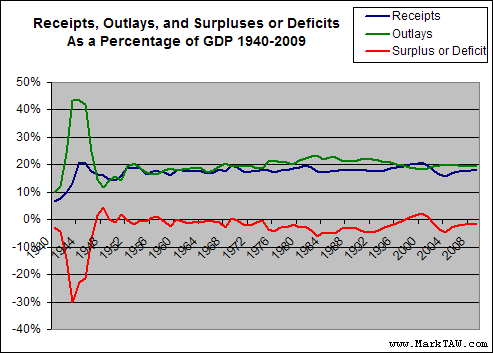
 What is remarkable about this graph is how consistent spending has been.
So why has the budget deficit fluctuated so much? Because our GDP is so huge that minor fluctuations in the percentage of revenue gained vs. amount spent equate into large swings of surpluses or deficits.
But, as you can see from the graph, the Bush administration is spending roughly the same amount of GDP as Clinton was. And Bush I and Reagan and Carter and......
So the next time some Leftist with a chip on their shoulder tells you how Bush is spending us into bankruptcy, just show them this graph, and the one below.
Government spending as % of GDP since 1940
By CosmicConservativeHere's another graph. This one is of actual U.S. Government spending as a percentage of Gross Domestic Product, again considered the best way to evaluate these things.
What is remarkable about this graph is how consistent spending has been.
So why has the budget deficit fluctuated so much? Because our GDP is so huge that minor fluctuations in the percentage of revenue gained vs. amount spent equate into large swings of surpluses or deficits.
But, as you can see from the graph, the Bush administration is spending roughly the same amount of GDP as Clinton was. And Bush I and Reagan and Carter and......
So the next time some Leftist with a chip on their shoulder tells you how Bush is spending us into bankruptcy, just show them this graph, and the one below.
What is remarkable about this graph is how consistent spending has been.
So why has the budget deficit fluctuated so much? Because our GDP is so huge that minor fluctuations in the percentage of revenue gained vs. amount spent equate into large swings of surpluses or deficits.
But, as you can see from the graph, the Bush administration is spending roughly the same amount of GDP as Clinton was. And Bush I and Reagan and Carter and......
So the next time some Leftist with a chip on their shoulder tells you how Bush is spending us into bankruptcy, just show them this graph, and the one below.
Comments (7)